Last week I had to optimise a lot of MongoDB queries. Here’s how I did it.
Introduction
I run uptimeline.com. It’s a website monitoring tool that makes thousands of calls every minute to check that websites are up and running.
Every call runs inside of its own AWS lambda function which needs to obtain the information of the website to check from the database. This means that there are thousands of lambdas that query the DB every minute.
Moreover these lambdas are spawned by a central lambda that executes once a minute and figures out which websites are due for checking and which are not. This means scanning the entire table of monitors on the DB every minute.
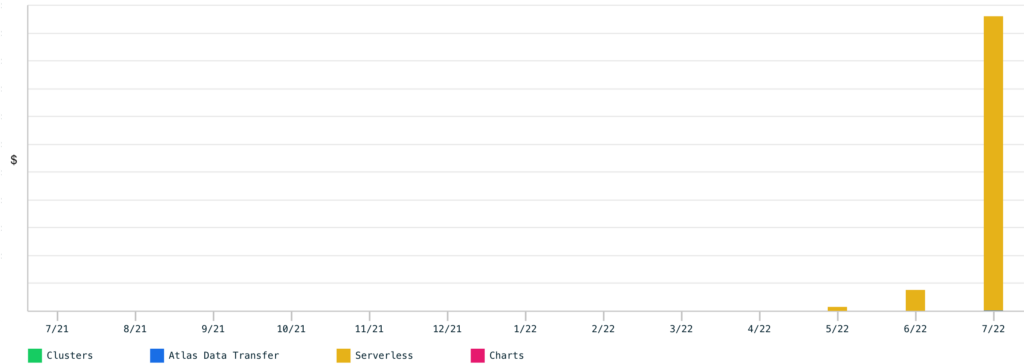
After releasing a large refactor that introduced the architecture I just described, I got a notification from MongoDB Atlas that my spending for the DB had spiked. I had burned hundreds of dollars in a matter of a few hours.
I don’t like to think about optimisation until performance becomes an issue as a way to make sure not to over-optimise. Now however, the time to optimise had come. This article is a how-to guide for the past me to solving the issue I had.
How to analyse a MongoDB query
I’ll jump straight to the interesting part.
The MongoDB Explain command was the protagonist of the workflow I’ve devised to optimise my queries. Since I use “NoSQLBooster for MongoDB” as a GUI, which conveniently comes with a GUI for explain, I’ll be showing that here.
Here’s a query that’s not optimised
The way explain works is that you write a query and provide it as input to the explain command.
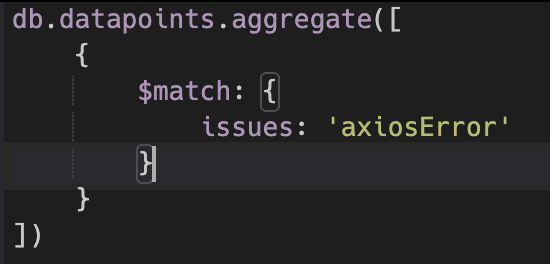
In this collection there is no index on issues so I expect this query to scan the whole collection to find the documents that match the filter. Here’s what explain returns:
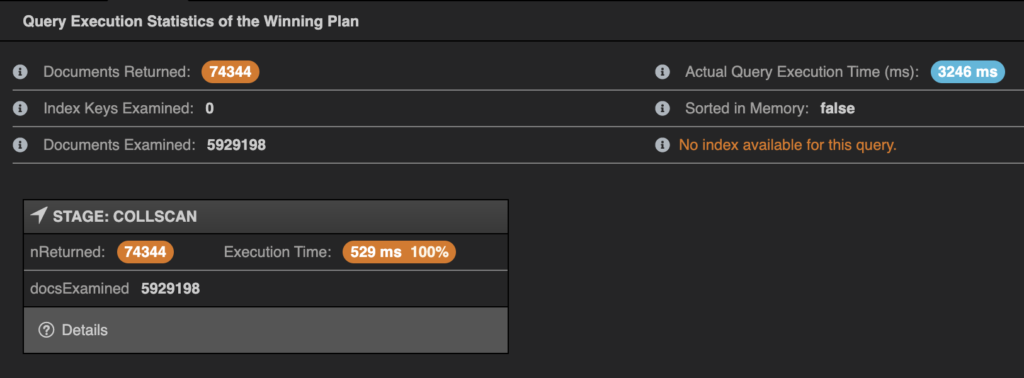
What you can note is the following:
- “No index available for query” indicates that no index was used
- Documents returned tells us how many documents match our query, in this case 70k
- Documents examined shows how many documents were actually read, in this case 6M
How to optimise your MongoDB query
If we created an index on the issues field we would save up 6M document reads every time this query is run. This last part is very important. The more often a query runs, the more important it is that it be optimised.
Therefore, in your effort to optimise your app, you should prioritise queries to optimise by how often they’re executed.
Here are the results of the same query after adding the index
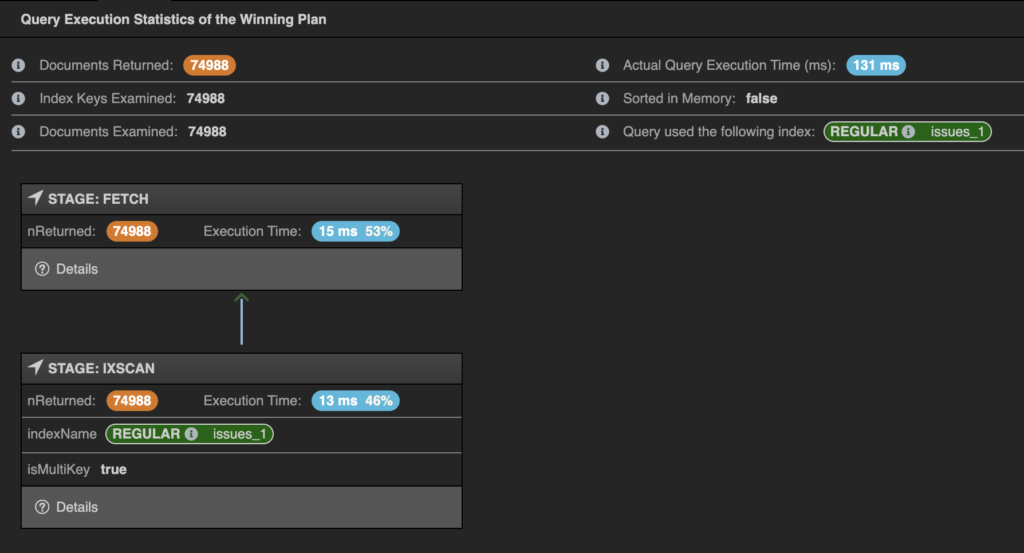
As you can see the query used the index now, and the number of documents examined matched the number of documents returned. The execution time also went from 500ms to 130ms.
The full workflow
So you now know how to analyse a single query. Next step is to list all the queries that your app makes, and for each determine:
- how often we make the query
- how big is the collection the query runs on
Sort your queries by decreasing frequency * collection size and analyse and optimise each query like described above!
Optimising Aggregations
The same workflow works for aggregations. Here are a few things to keep in mind however that made me lose some time:
- $facet aggregation stage doesn’t use indexes, ever. If you want to optimise a query with a $facet you need to remove the $facet. Rather split the query into multiple indexed queries.
- $group aggregation stage only uses indexes in a very specific scenario, described here
Optimising queries on MongoDB Atlas Serverless
If like me you’re running on MongoDB Atlas Serverless, here are some tools that I have found handy.
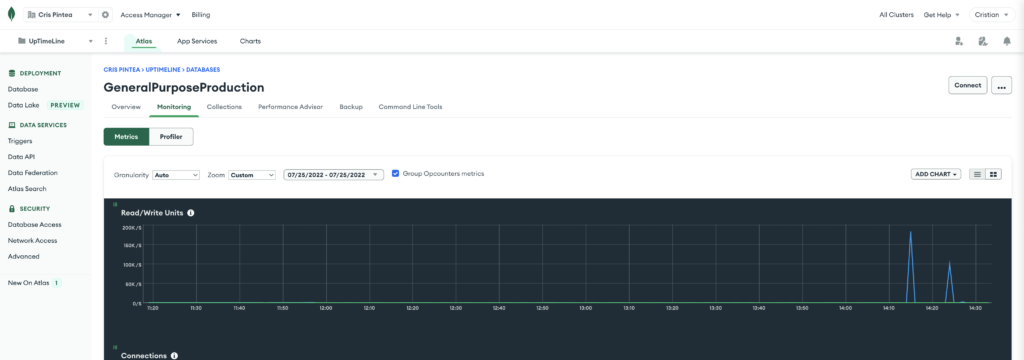
Monitoring Dashboard
If your objective is to decrease cost, you want to minimise document reads and writes (here’s why). You can check your current performance in that sense from the monitoring tab of your cluster.
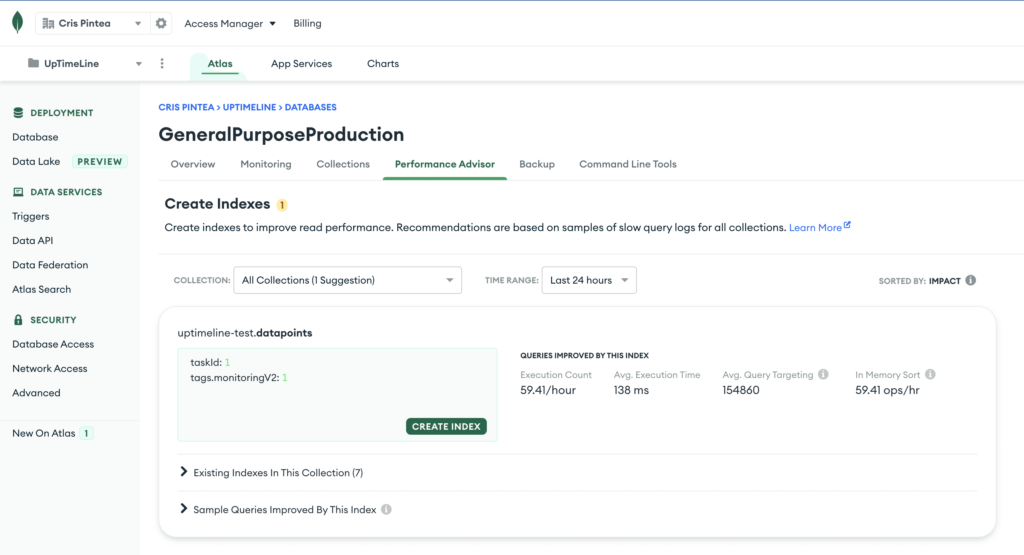
Performance Advisor
A handy tool to prioritise queries is the Performance Advisor. It only shows the most obvious performance issues so don’t assuma that because it’s not showing you anything you’ve already optimised. However if your app has some serious performance issues, it might point you towards the worst performing ones.
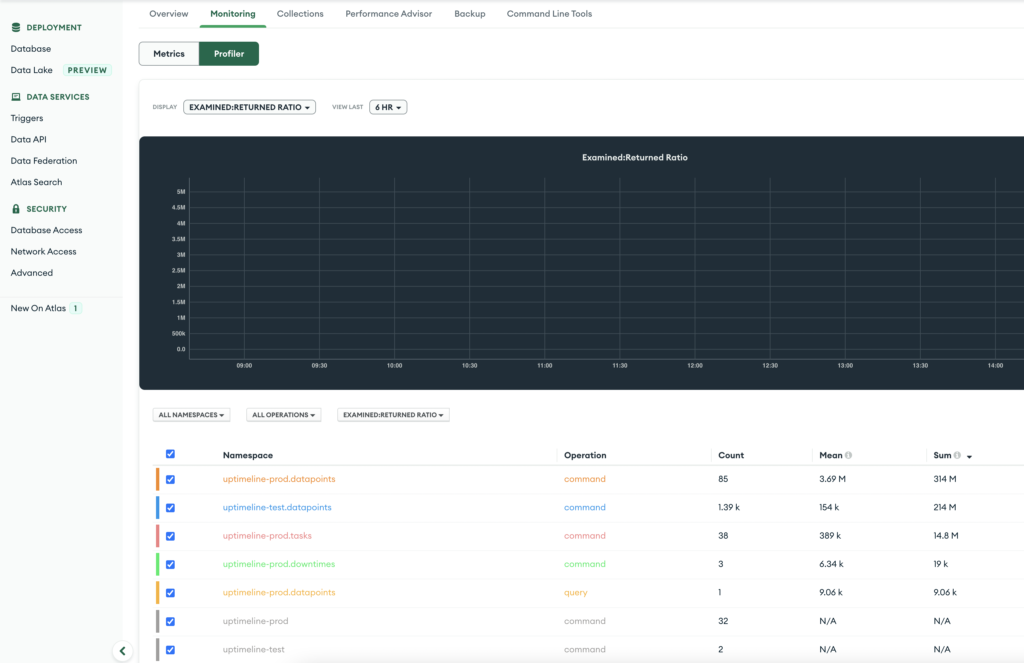
Profiler
Finally, through the profiler you can view your queries sorted by their documents scanned : returned ratio. Again it’s not perfect and won’t allow you to find all issues, but it’s a start.
TL;DR
Key takeaways:
- minimise the docs scanned : returned ratio
- do this by making sure that all queries use an index
- use the explain command to check wether queries use an index, and their docs scanned : returned ratio
and
- you want to prioritise queries that execute often AND scan large collections
- $facet doesn’t support indexes, $group only supports them in a very specific scenario
I hope you can now go optimise your MongoDB queries!
If you found my article useful and wanna receive useful stuff I learn and write about, consider signing up for my newsletter in the footer below!